The Low End of Market Rental (LEMR) Housing Monitor defines affordability in the rental market based on the city where the housing is located, and on the median incomes and size of renter families. As a result, the LEMR Housing Monitor presents thresholds for affordable rent which vary by region and household composition.
Using data obtained from Statistics Canada, the graphs below demonstrate that rents have become increasingly unaffordable, despite rising incomes. However, this effect is not uniform across regions or unit sizes. This analysis highlights who, and where, the affordability crisis is hitting the hardest.
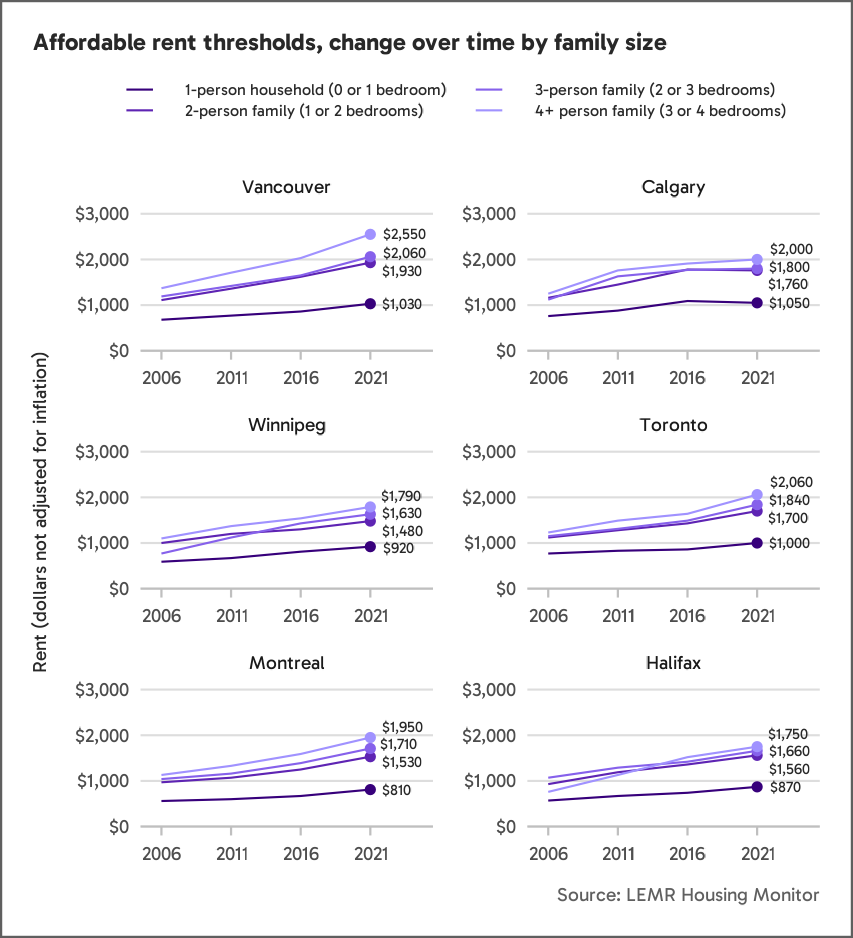
The changing thresholds shown in Figure 1 below reflect increasing incomes of renter families and single individuals over this period. In other words, as a family’s income rises, higher rents become increasingly affordable to them.

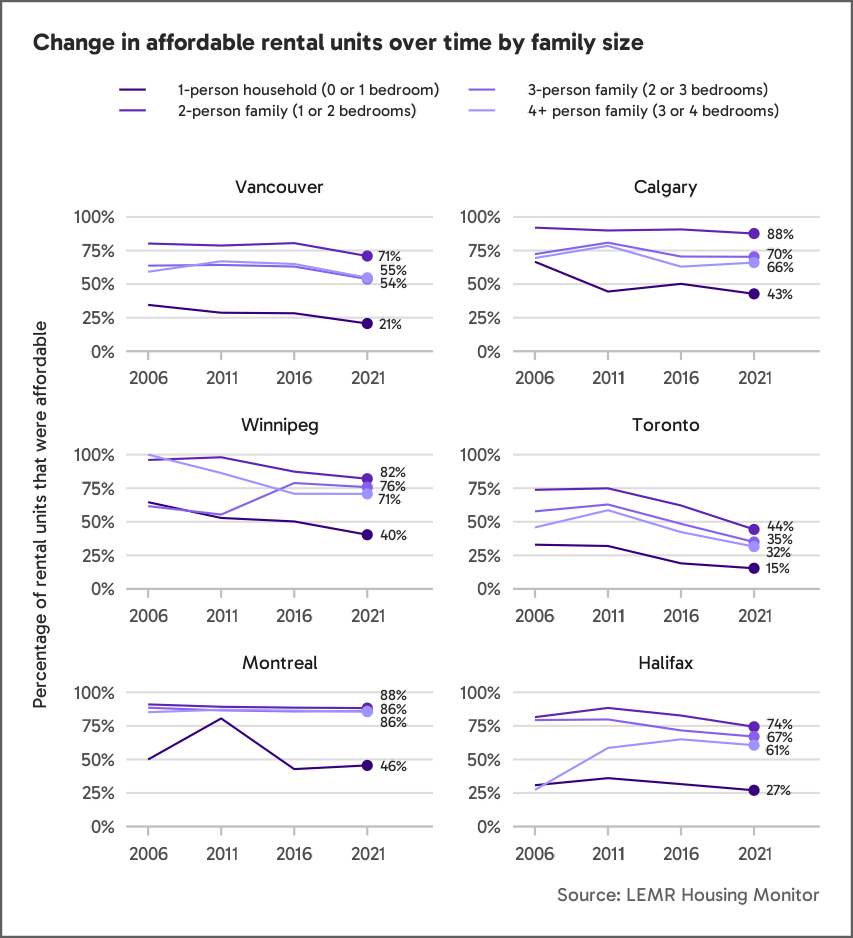
Figure 2 shows the change in the percentage of rental units that meet these affordability thresholds over time in each region.

Whereas some regions like Calgary and Montreal show little change in affordability over time, the effect is quite strong in other areas.
The steepest challenges are faced by single individuals in Toronto and Vancouver, followed by Halifax. In these cities, individuals with median incomes can only afford a very small percentage of studio or 1-bedroom units. Toronto also shows the clearest decline in affordability over time, with the share of rental units affordable to median incomes being relatively low to start with and dropping across all family types.
Read our Data Definitions to learn how the LEMR Housing Monitor defines affordability.
