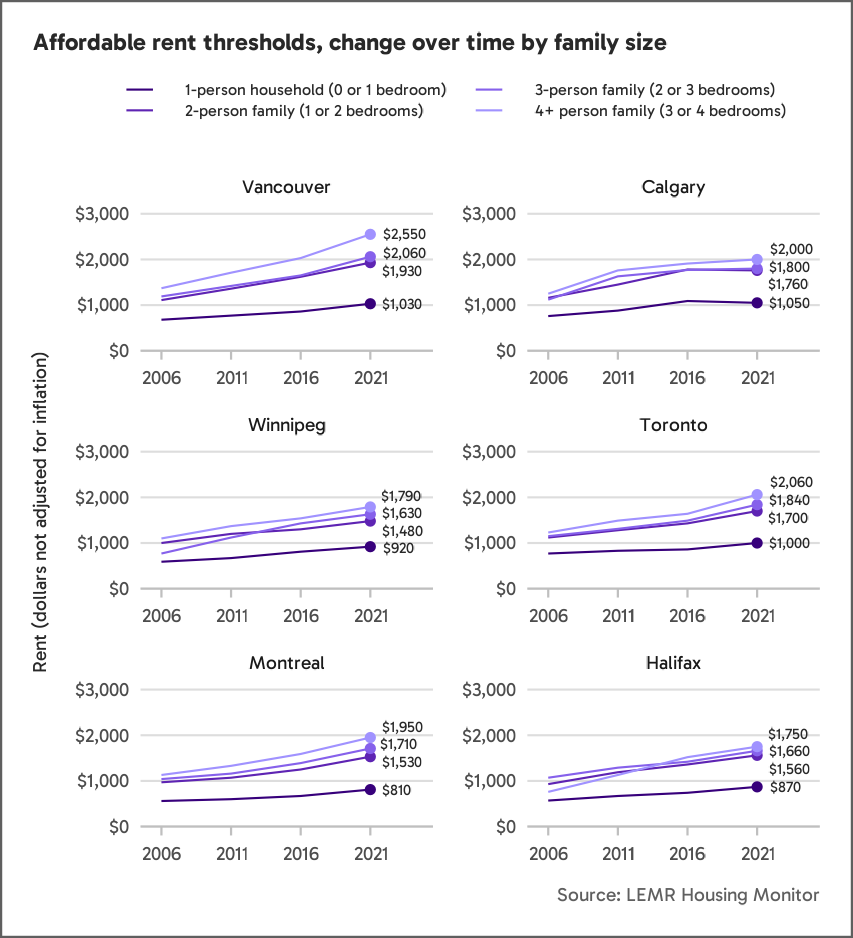
The Low End of Market Rental (LEMR) Housing Monitor defines affordability in the rental market based on the city where the housing is located, and on the median incomes and size of renter families. As a result, the LEMR Housing Monitor presents thresholds for affordable rent which vary by region and household composition.
Using data obtained from Statistics Canada, the graphs below demonstrate that rents have become increasingly unaffordable, despite rising incomes. However, this effect is not uniform across regions or unit sizes. This analysis highlights who, and where, the affordability crisis is hitting the hardest.
The changing thresholds shown in Figure 1 below reflect increasing incomes of renter families and single individuals over this period. In other words, as a family’s income rises, higher rents become increasingly affordable to them.
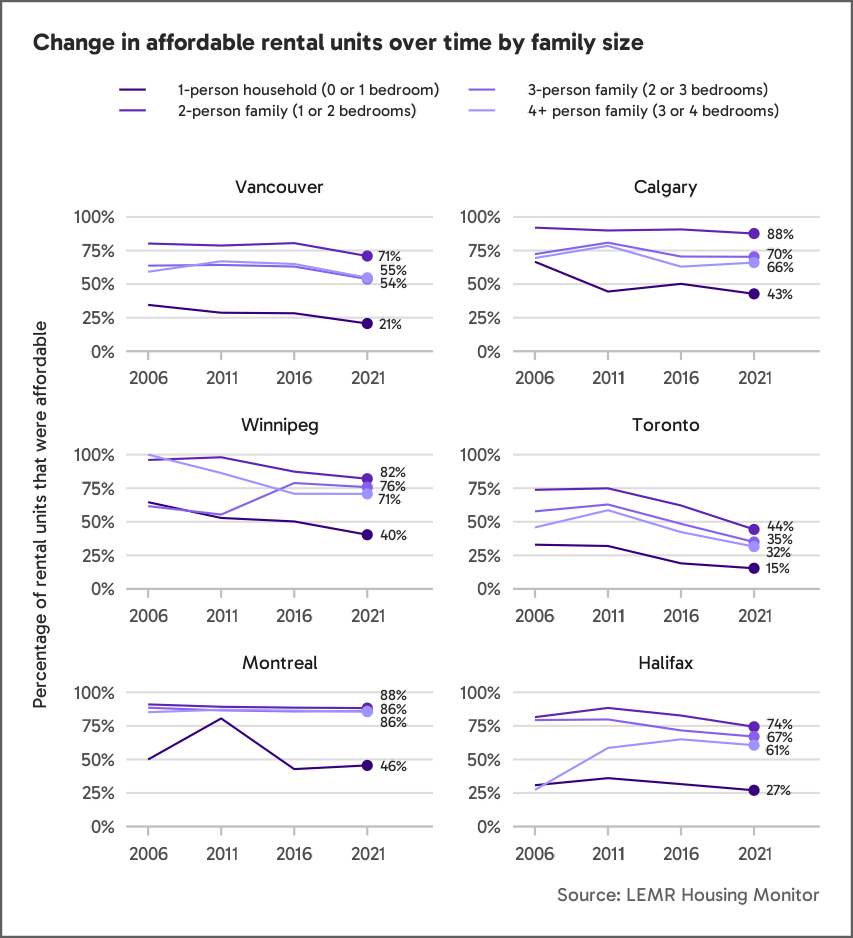
Figure 2 shows the change in the percentage of rental units that meet these affordability thresholds over time in each region.
Whereas some regions like Calgary and Montreal show little change in affordability over time, the effect is quite strong in other areas.
The steepest challenges are faced by single individuals in Toronto and Vancouver, followed by Halifax. In these cities, individuals with median incomes can only afford a very small percentage of studio or 1-bedroom units. Toronto also shows the clearest decline in affordability over time, with the share of rental units affordable to median incomes being relatively low to start with and dropping across all family types.
Read our Data Definitions to learn how the LEMR Housing Monitor defines affordability.
Halifax Data Map
A centralized data mapping tool that presents critical information on the location and characteristics of the affordable “low-end” of market rental housing stock in Halifax.
Records relevant to eviction proceedings were obtained via Freedom of Information requests for the LEMR Housing Monitor in Calgary, Vancouver, Toronto, Winnipeg, and Halifax. Below we highlight several trends we observed in these filings over time in each region, as well as details on how institutions vary in the data they collect.
It is important to note that these records refer to eviction-relevant legal proceedings which typically result from a dispute between a landlord and a tenant. These records do not include, for example, evictions in which the tenant vacated the residence without going to court.
Read our Data Definitions for information about the sources of these records.
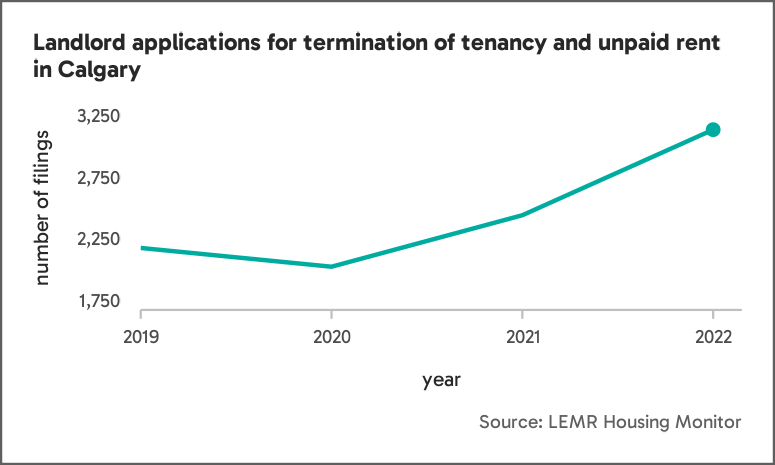
Calgary
In Calgary, we obtained eviction records related to landlord applications made to Alberta’s Residential Tenancy Dispute Resolution Service for termination of tenancy and unpaid rent. Overall, these data showed a slight decrease in landlord applications between 2019 and 2020 followed by an upward trajectory.
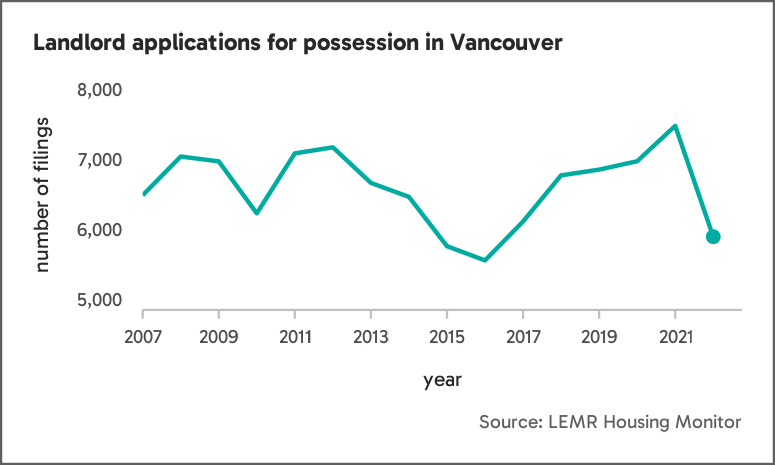
Vancouver
In Vancouver, we obtained eviction records related to applications made to British Columbia’s Residential Tenancies Branch in which a landlord was seeking to take possession of a rental unit. These data showed several periods between 2007 and 2022 where a sharp decline was followed by a sharp increase.
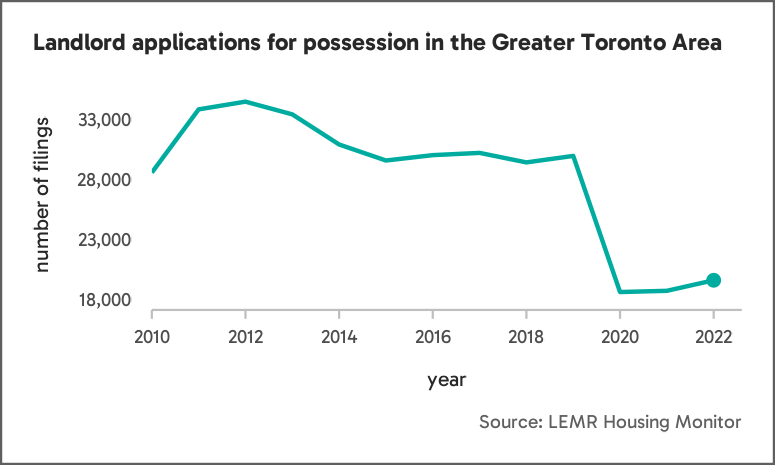
Greater Toronto Area
In the Greater Toronto Area, we obtained eviction records related to the following landlord applications made to Ontario’s Landlord and Tenant Board:
L1: Application to evict a tenant for non-payment of rent and to collect rent the tenant owes.
L2: Application to end a tenancy and evict a tenant or collect money.
L3: Application to end a tenancy – tenant gave notice or agreed to terminate the tenancy.
L4: Application to end a tenancy and evict a tenant – tenant failed to meet conditions of a settlement or order.
Sometimes records include more than one application. Cases that included at least one L1, L2, L3, or L4 were included in our analysis. Overall, these data show a downward trend between 2010 and 2022.
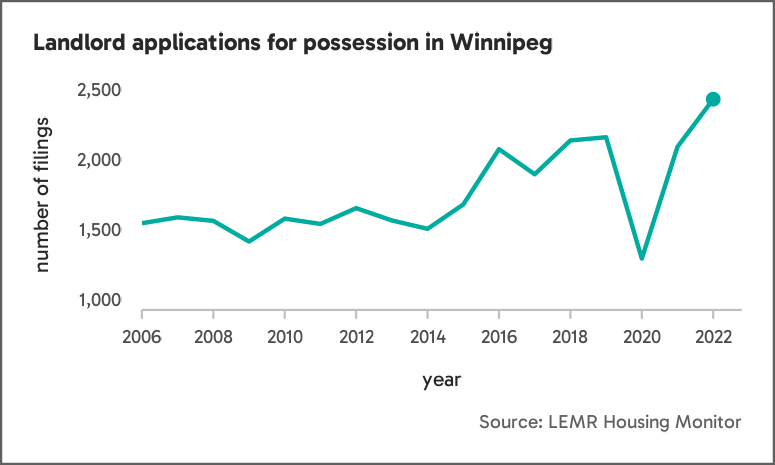
Winnipeg
In Winnipeg, we obtained eviction records related to Orders of Possession that were requested either for unpaid rent or for other reasons. Overall, these data show a general upward trajectory in filings with Manitoba’s Residential Tenancies Branch between 2006 and 2022.
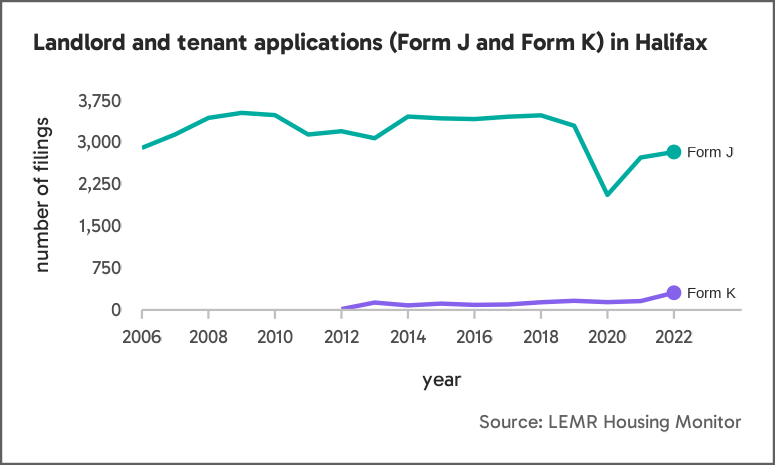
Halifax
In Halifax, we obtained eviction records related to the following applications at Nova Scotia’s Residential Tenancies Program:
Form J: Apply to the Director of Residential Tenancies to resolve a dispute between a landlord and tenant.
Form K: Apply to the Director of Residential Tenancies to end a tenant’s lease because of unpaid rent without participating in a hearing or mediation with the tenant.
These data differ from the other provinces in that Form J may be used by a landlord or a tenant for a variety of issues, including disputes over evictions, or the return of a security deposit. Form K, in contrast, is used exclusively by landlords, but only represent a subset of eviction filings in which the reason for eviction is unpaid rent and the landlord wishes to proceed without a hearing or attempt to mediate with the tenant. The landlord cannot file a Form K if the tenant filed a Form J or if the landlord wishes to receive additional compensation, such as compensation for damages. These data show a slight increase in Form K filings over time. Form J filings showed a sharp decrease in 2020, followed by a sharp increase.
Conclusion
Provincial differences in the processing of eviction filings make direct comparison across regions imperfect. Nonetheless, the differences across regions shown above indicate that eviction filings do not follow a uniform trajectory. Rather, regions differ, sometimes dramatically, in eviction filing trends, pointing to the need to evaluate housing issues from both broad systemic and local perspectives.
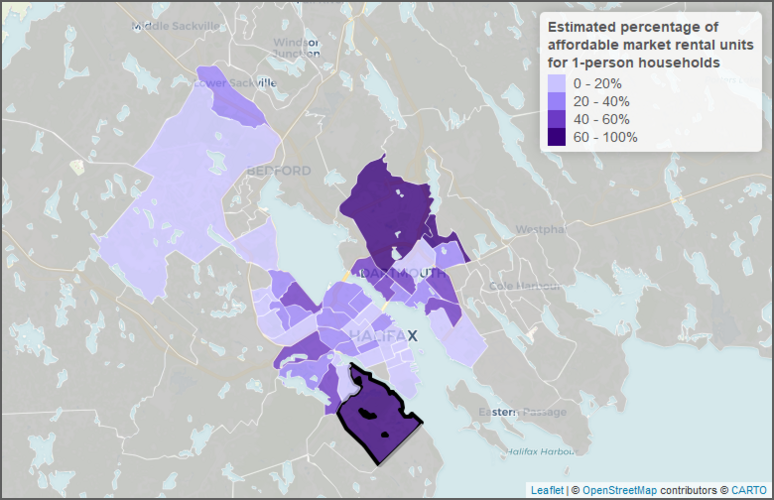
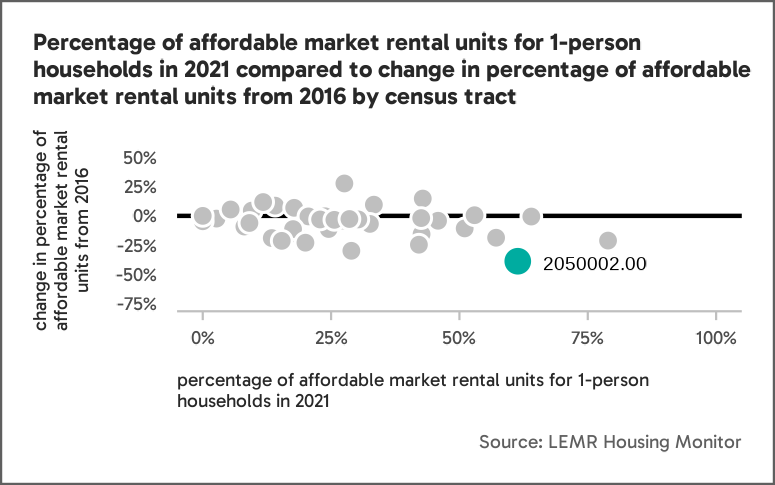
In 2021, there were only three census tracts in the Halifax Regional Municipality in which more than 60 per cent of private market units suitable for 1-person households were affordable1. Two of these census tracts were in Dartmouth, located on the eastern shore of the Halifax Harbour. The third census tract is largely contained in the community of Spryfield, a region south of the Halifax peninsula. This region corresponds to census tract number 2050002.00 and is outlined in black on the map below.
Despite census tract 2050002.00 having one of the greatest proportions of affordable 1-person household market units, this region also experienced some of the greatest loss of affordable market units between 2016 and 2021. The figure below shows Halifax census tracts by proportion of affordable market units in 2021, as well as how this proportion has changed since 2016. Points below the horizontal black line represent census tracts that have experienced a decrease in affordable units between 2016 and 2021, and points above the line are census tracts that have experienced an increase. In census tract 205002.00, 61 per cent of available 1-person household units were in the low-end cost of the market in 2021, which represents a 39 per cent decrease from 2016.
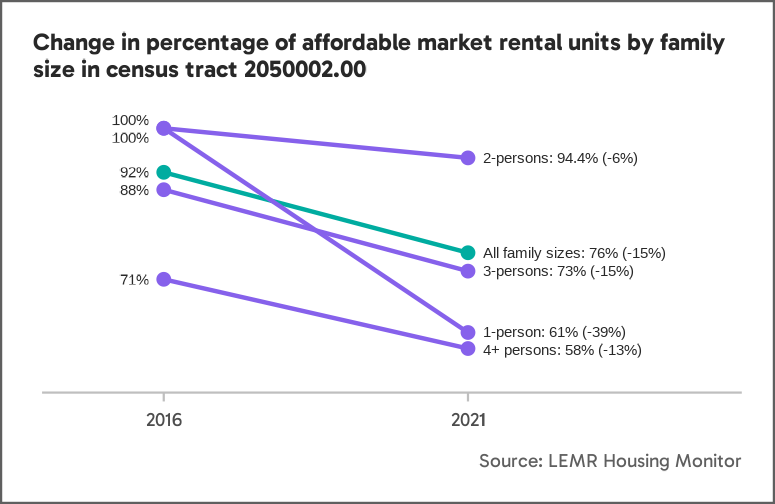
Although this region experienced an especially pronounced decrease in affordable private market units suitable for 1-person households, a loss of affordable market units was also observed across all other household sizes, as displayed in the figure below.
Contextualizing change in affordable market units
Data available through the LEMR Housing Monitor can help contextualize changes in this community’s affordable private market rental housing stock. Factors such as building age and need for repairs, or recent turnover in building ownership, for example, may help explain this loss in units.
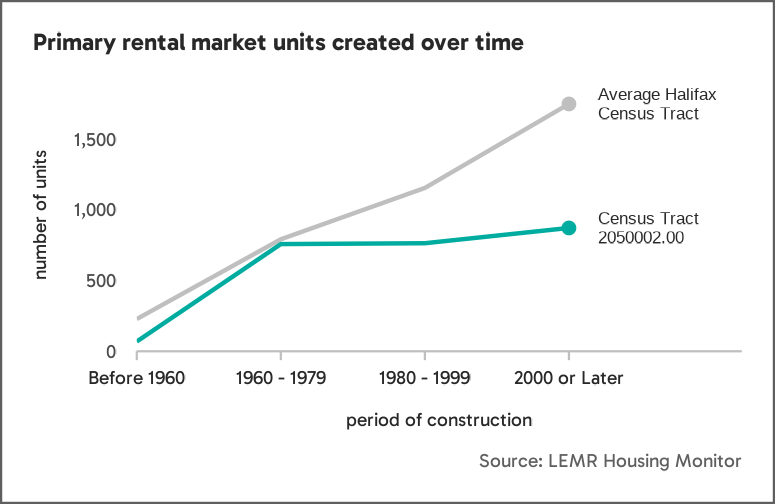
For instance, census tract 2050002.00 is known for its primary rental market stock, which was mainly constructed in the 1970s. The figure below shows that in comparison to other regions in Halifax, very little construction of primary market units occurred in this region after 1980.
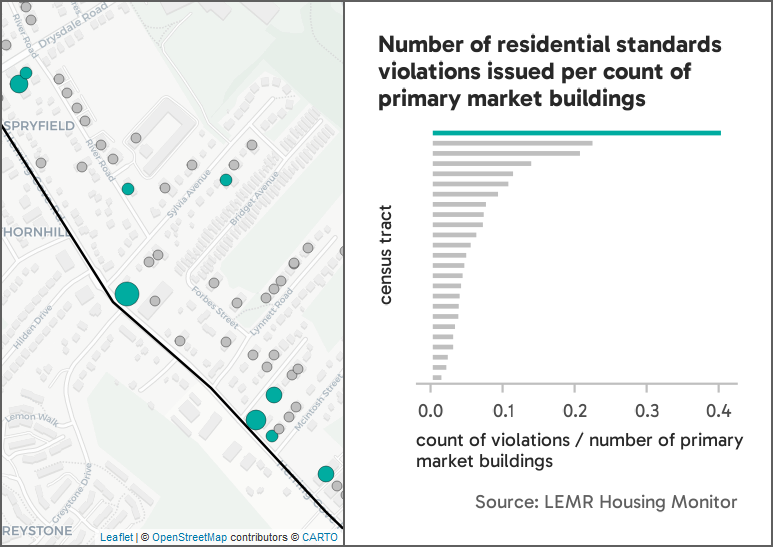
Moreover, many of these buildings have been in violation of Halifax’s residential building safety standards in recent years. The map below shows numerous primary market buildings in census tract 2050002.00 with reported issues since 2020 (shown in turquoise), and several that have had multiple different issues reported in this time frame (shown by bigger markers).
As shown in the figure to the right of the map, this census tract has more reports filed per primary market building than any other census tract, with approximately one report for every 2.5 buildings.
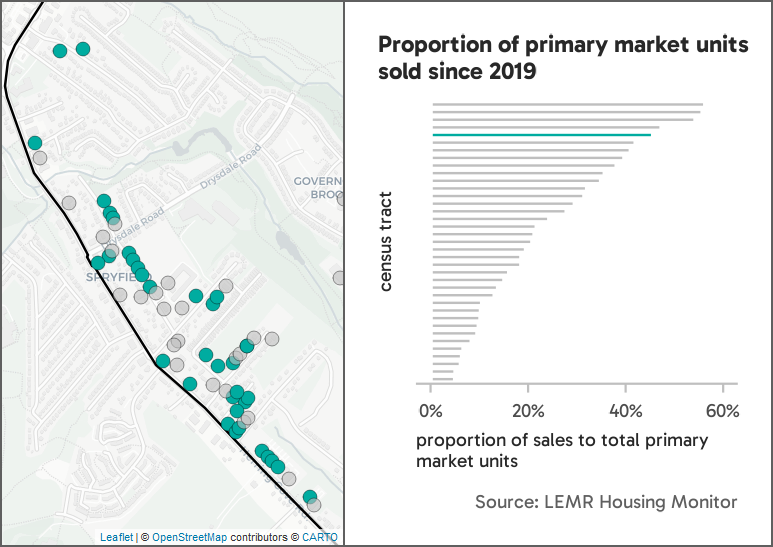
In addition to being unique in building age and condition, the primary market stock in census tract 2050002.00 also showed a high rate of sales activity relative to most other regions in Halifax. The map below shows buildings in census tract 2050002.00 that have had at least one sales transaction since 2019. The figure to the right shows that approximately 50% of primary market units in the region were sold since 2019.
Integrating available building-level details can help contextualize higher-level trends in the housing market. As demonstrated in census tract 2050002.00, declines in affordable market units appear to coincide with unique features of the primary market stock, such as building age, building condition, and sales history. As the LEMR Housing Monitor integrates more datasets, explanations for change in affordable rental housing may become increasingly clear.
1 A census tract is a geographic area used by Statistics Canada. The LEMR Housing Monitor estimates the proportion of rental units in the low-end of market based on rents reported in the 2021 census by tenants who moved within the previous five years and excludes renters who received rent subsidy. For more information, see our Data Definitions. This analysis only includes census tracts where there were at least 60 new movers within the past five years.
Freedom of Information (FOI) laws are meant to ensure that the public has access to records that belong to the public. This legislation is important for maintaining democracy and accountability, as it allows citizens to know how institutions are performing and how decisions that affect them are made. Anyone has the right to submit an FOI request and these requests are often used to obtain data on police services, court proceedings, property information, and more.
When developing the Low-End of Market Rental (LEMR) Housing Monitor, we used FOI requests to obtain eviction proceeding records including the date, rental address, reason for eviction, and result. It is important to note that these records only include eviction orders that have been registered with a Landlord and Tenant Board (or equivalent), usually because of a legal dispute. Evictions that took place without initiating a formal legal proceeding are not included in these records.
Here we break down some of the challenges we experienced in collecting data through FOI requests, and the implications for knowledge building.
Factors Affecting Timing
On average, it took 151.2 days to receive eviction order data from each province included in the LEMR Housing Monitor, except for Quebec which did not provide any records despite repeated requests.
Number of days between application and receipt of data
Province
Number of Days
Alberta
154 days
British Columbia
59 days
Manitoba
88 days
Nova Scotia
197 days
Ontario
258 days
Quebec
No data received
Several factors may have contributed to the length of time taken to receive evictions data. First, in all provinces, it was not clear how, or which, data is being stored. As a result, data requests were negotiated over several weeks or months via FOI administrators until the request was modified to facilitate sharing of a dataset that the governing body felt they could provide. In the case of Quebec, two requests were made and both were denied without a revision process, resulting in no eviction-related data being available for the Greater Montreal Area map.
Timelines also varied because of extension requests. Alberta, British Columbia, and Nova Scotia all formally requested multiple extensions. Additional delays were the result of administrative difficulties, including payments being sent to the wrong department, as in Ontario, and amendments to agreements being requested after payment was received, as in Manitoba.
Data Formats and Redaction
Despite similar requests made in all provinces, the data that were provided varied. The most common modification requested by the governing bodies was to redact, or partially redact, location information. As a result, in Manitoba and British Columbia only partial postal code information was provided for each record. In Alberta, only the municipality name was provided. In Nova Scotia, records varied in having a partial postal code, a municipality name, or no location information whatsoever, resulting in missing data on the Halifax map.
An additional barrier was that the data formats varied, making it difficult to process and evaluate. Alberta and Manitoba both provided data tables saved as lengthy PDF documents. In Alberta, this document also contained pages where colour was shaded out (light grey text on a white background) making the document difficult to read. Overcoming these challenges required additional processing time after data were received in order to be useful for the LEMR Housing Monitor.
Implications
The challenges described above are not unique to FOI requests and can have serious implications for knowledge building. For developing the LEMR Housing Monitor, long wait times and lack of location information meant that an analysis of localized, short-term, emerging trends in eviction filings could not be undertaken.
While FOI requests have provided valuable information about evictions for the LEMR Housing Monitor, such as information on the frequency of eviction orders over time, addressing these systemic issues within the FOI process would facilitate greater opportunities for more nuanced analysis.