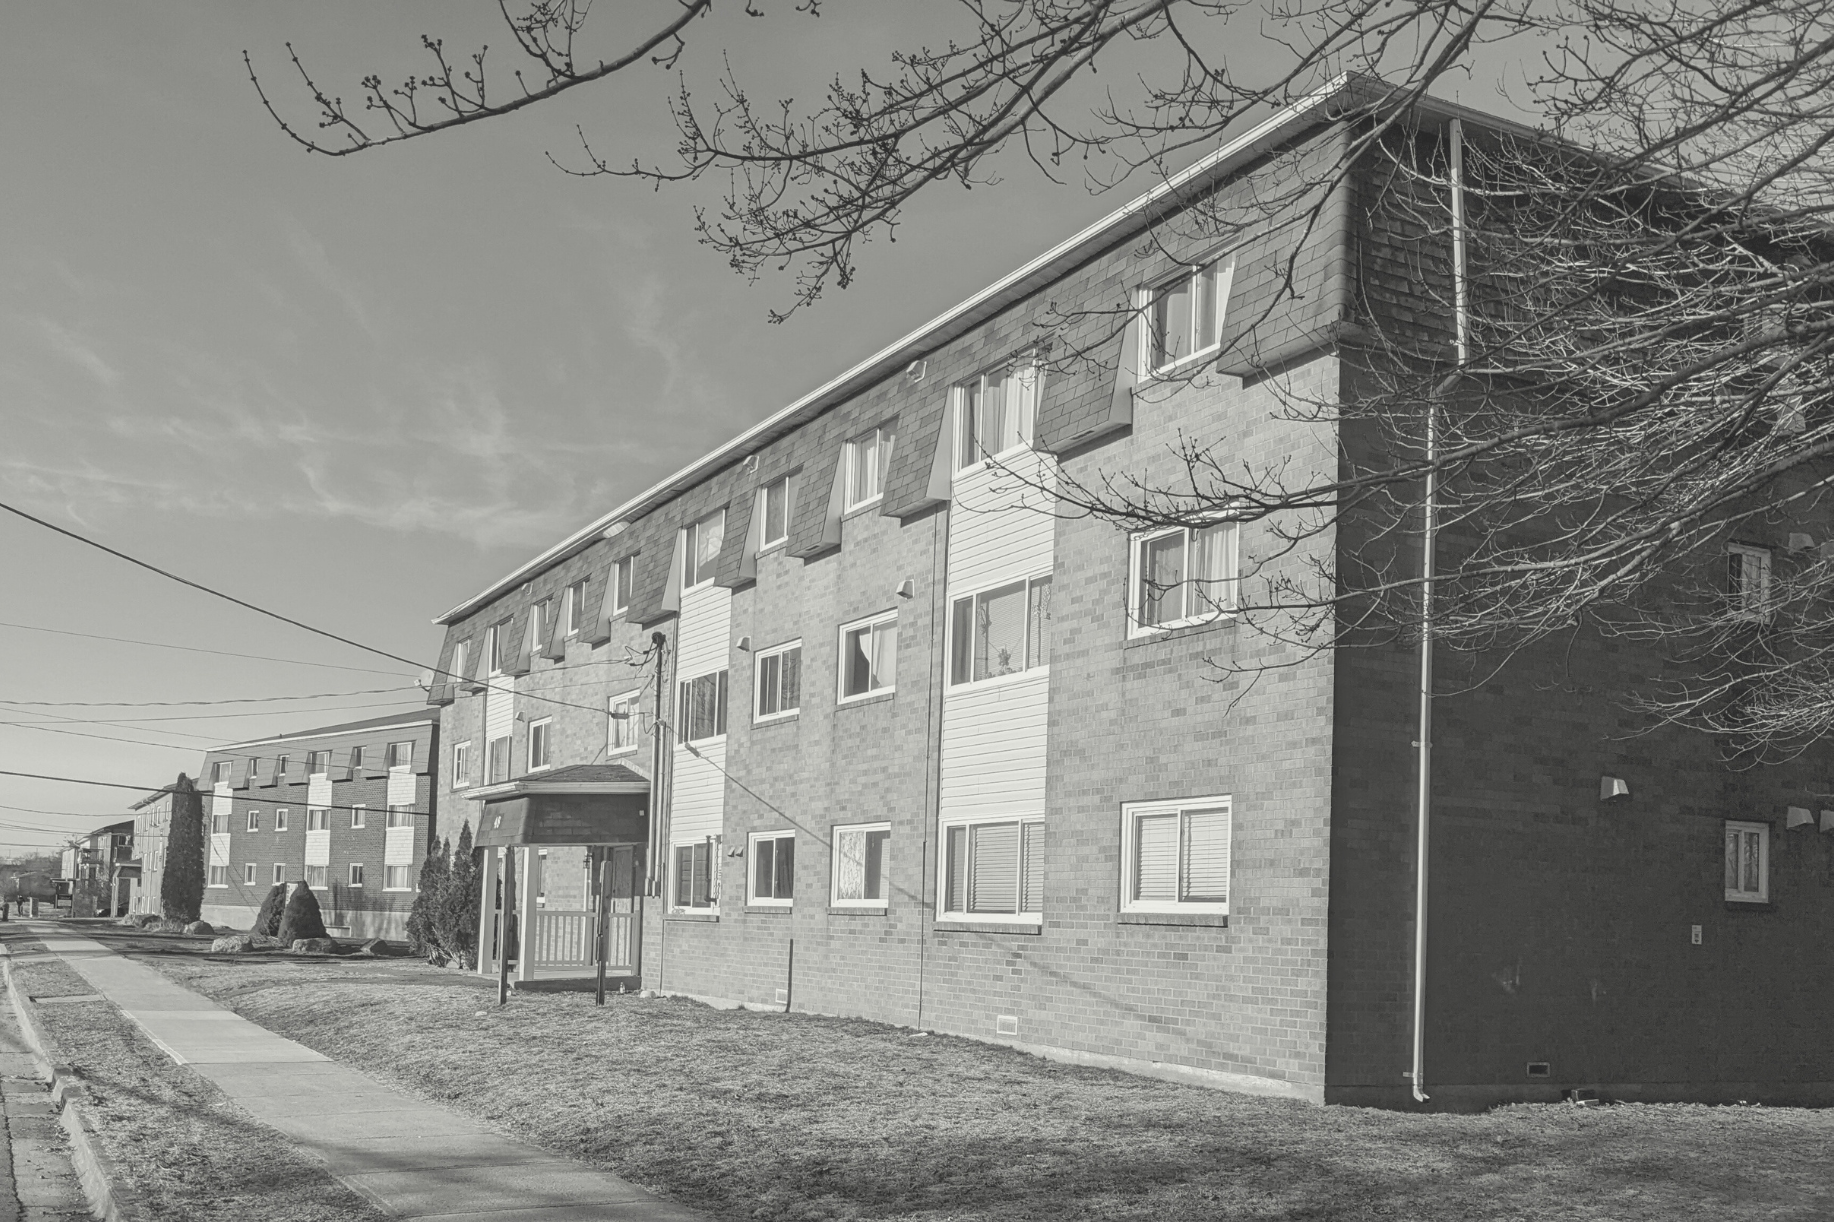
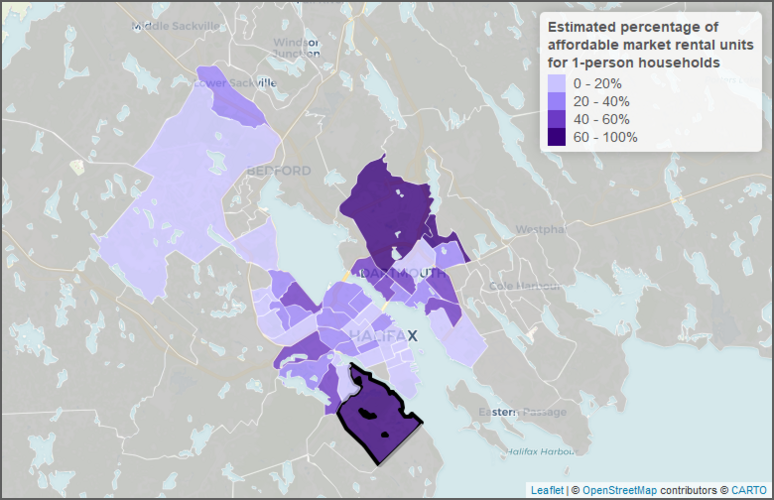
In 2021, there were only three census tracts in the Halifax Regional Municipality in which more than 60 per cent of private market units suitable for 1-person households were affordable1. Two of these census tracts were in Dartmouth, located on the eastern shore of the Halifax Harbour. The third census tract is largely contained in the community of Spryfield, a region south of the Halifax peninsula. This region corresponds to census tract number 2050002.00 and is outlined in black on the map below.
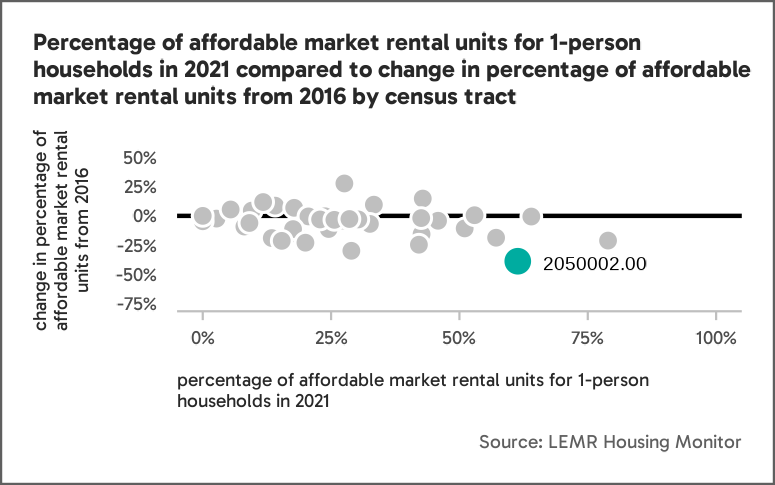
Despite census tract 2050002.00 having one of the greatest proportions of affordable 1-person household market units, this region also experienced some of the greatest loss of affordable market units between 2016 and 2021. The figure below shows Halifax census tracts by proportion of affordable market units in 2021, as well as how this proportion has changed since 2016. Points below the horizontal black line represent census tracts that have experienced a decrease in affordable units between 2016 and 2021, and points above the line are census tracts that have experienced an increase. In census tract 205002.00, 61 per cent of available 1-person household units were in the low-end cost of the market in 2021, which represents a 39 per cent decrease from 2016.
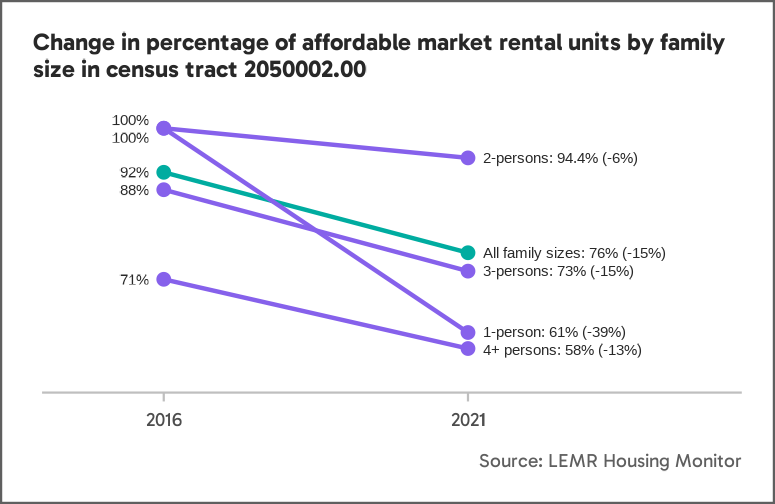
Although this region experienced an especially pronounced decrease in affordable private market units suitable for 1-person households, a loss of affordable market units was also observed across all other household sizes, as displayed in the figure below.
Contextualizing change in affordable market units
Data available through the LEMR Housing Monitor can help contextualize changes in this community’s affordable private market rental housing stock. Factors such as building age and need for repairs, or recent turnover in building ownership, for example, may help explain this loss in units.
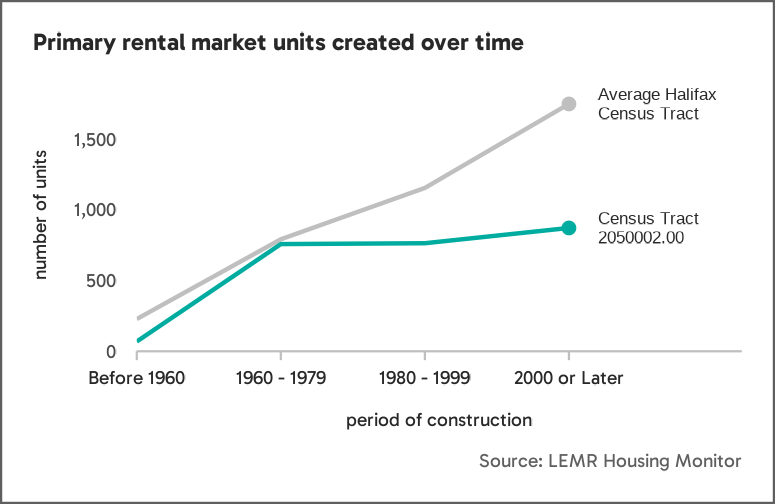
For instance, census tract 2050002.00 is known for its primary rental market stock, which was mainly constructed in the 1970s. The figure below shows that in comparison to other regions in Halifax, very little construction of primary market units occurred in this region after 1980.
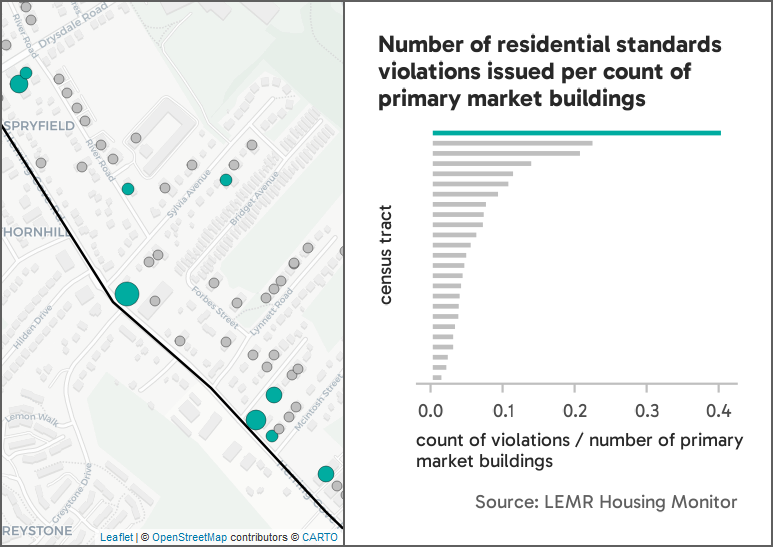
Moreover, many of these buildings have been in violation of Halifax’s residential building safety standards in recent years. The map below shows numerous primary market buildings in census tract 2050002.00 with reported issues since 2020 (shown in turquoise), and several that have had multiple different issues reported in this time frame (shown by bigger markers).
As shown in the figure to the right of the map, this census tract has more reports filed per primary market building than any other census tract, with approximately one report for every 2.5 buildings.
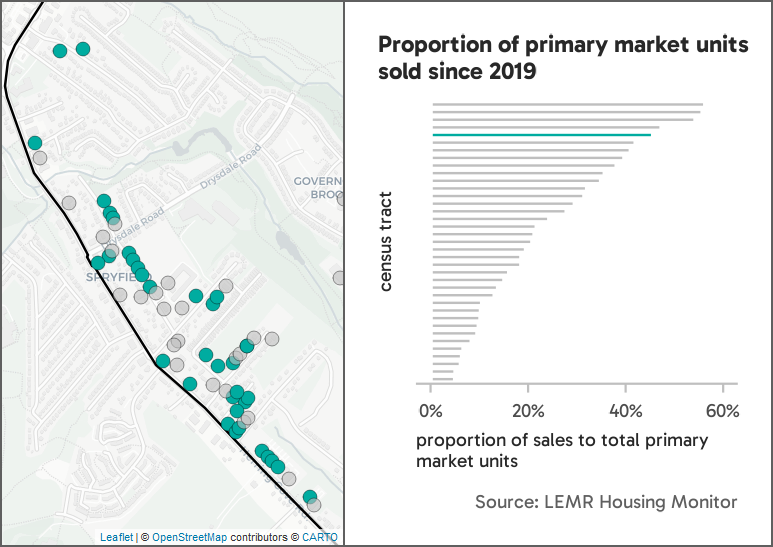
In addition to being unique in building age and condition, the primary market stock in census tract 2050002.00 also showed a high rate of sales activity relative to most other regions in Halifax. The map below shows buildings in census tract 2050002.00 that have had at least one sales transaction since 2019. The figure to the right shows that approximately 50% of primary market units in the region were sold since 2019.
Integrating available building-level details can help contextualize higher-level trends in the housing market. As demonstrated in census tract 2050002.00, declines in affordable market units appear to coincide with unique features of the primary market stock, such as building age, building condition, and sales history. As the LEMR Housing Monitor integrates more datasets, explanations for change in affordable rental housing may become increasingly clear.
1 A census tract is a geographic area used by Statistics Canada. The LEMR Housing Monitor estimates the proportion of rental units in the low-end of market based on rents reported in the 2021 census by tenants who moved within the previous five years and excludes renters who received rent subsidy. For more information, see our Data Definitions. This analysis only includes census tracts where there were at least 60 new movers within the past five years.